
Introduction
This article is not just about analysing a malware sample, it's more about sharing my malware analysis methodology in general, and the sample I used has some interesting characteristics that make it a good candidate for demonstration.
The sample is from a Chinese APT group known as RedDelta. The sample itself is just a loader written in Nim, which might look new to some of you, but Nim has been gaining popularity among threat actors in recent years because of its ability to produce small, self-contained, efficient binaries that can easily evade detection.
Setting Up the Environment
I recommend using my windows-sandbox-init project to set up a Windows sandbox environment quickly. It automates the installation of essential tools like Ghidra, x64dbg, Wireshark, and others, saving you time and effort.
After setting up the sandbox, download the sample and put it in the shared directory MALWARE so it can be accessed from within the sandbox.
Initial Analysis
Where to Start
It might sound obvious, but the first step is to gather as much information about the sample as possible. You can use tools like strings, PEiD, or Detect It Easy to get a quick overview of the binary.
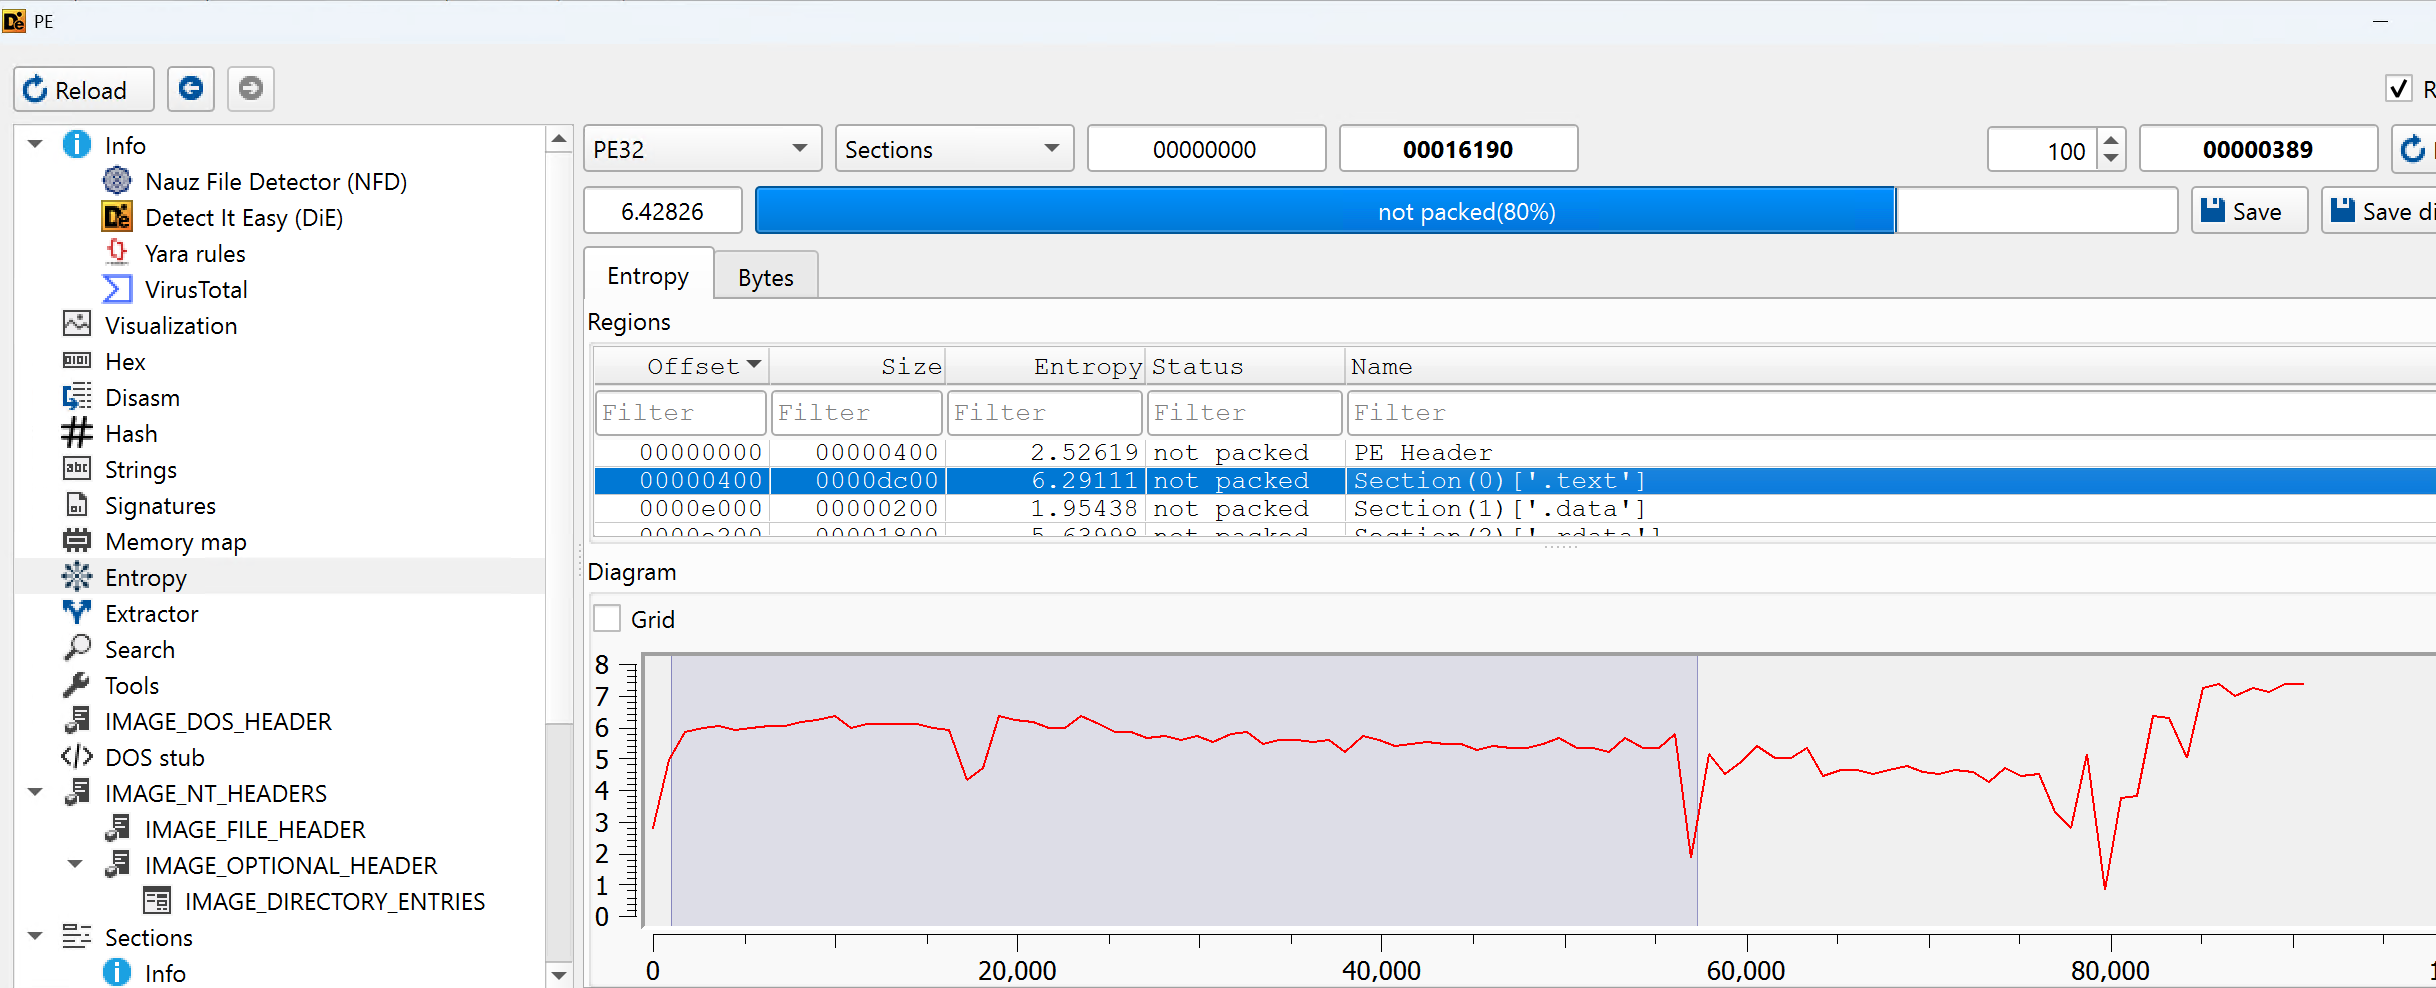
In this case, we simply analyse it with Detect It Easy, which tells us that the sample is a Nim binary. If you like, there are plenty of useful features right there in this tool, such as checking for packers, compilers, and other metadata.
Now, we can see that this is a DLL written in Nim, and in entropy tab, we can pretty much confirm that the binary is not packed or obfuscated, which saves us some time in unpacking it.
Everything else can be explored later in Ghidra.
Run It
The first thing you do after getting a malware sample is run it, right?
If it's an executable, you can just run it directly in a sandbox and observe its behaviour, that's where you find your clue about what the malware is doing, and where to focus your analysis.
If it's a DLL like this one, you will need to understand how it's being loaded and executed. You can use tools like rundll32.exe or write a simple loader program to load the DLL and call its exported functions.
What if you can't observe anything, like this one, it just silently exits without any noticeable activity?
Then it's time to dig deeper with static and dynamic analysis.
Static Analysis Using Ghidra
Every program has to import functions from system libraries to perform various tasks. By examining the imported functions, we can gain insights into the program's behavior. But wait, this is a DLL, we definitely need to find out what functions are being exported first.
Why? Because the exported functions are the entry points that other programs use to interact with the DLL. By analyzing these functions, we can understand how the DLL is intended to be used and what functionality it provides.
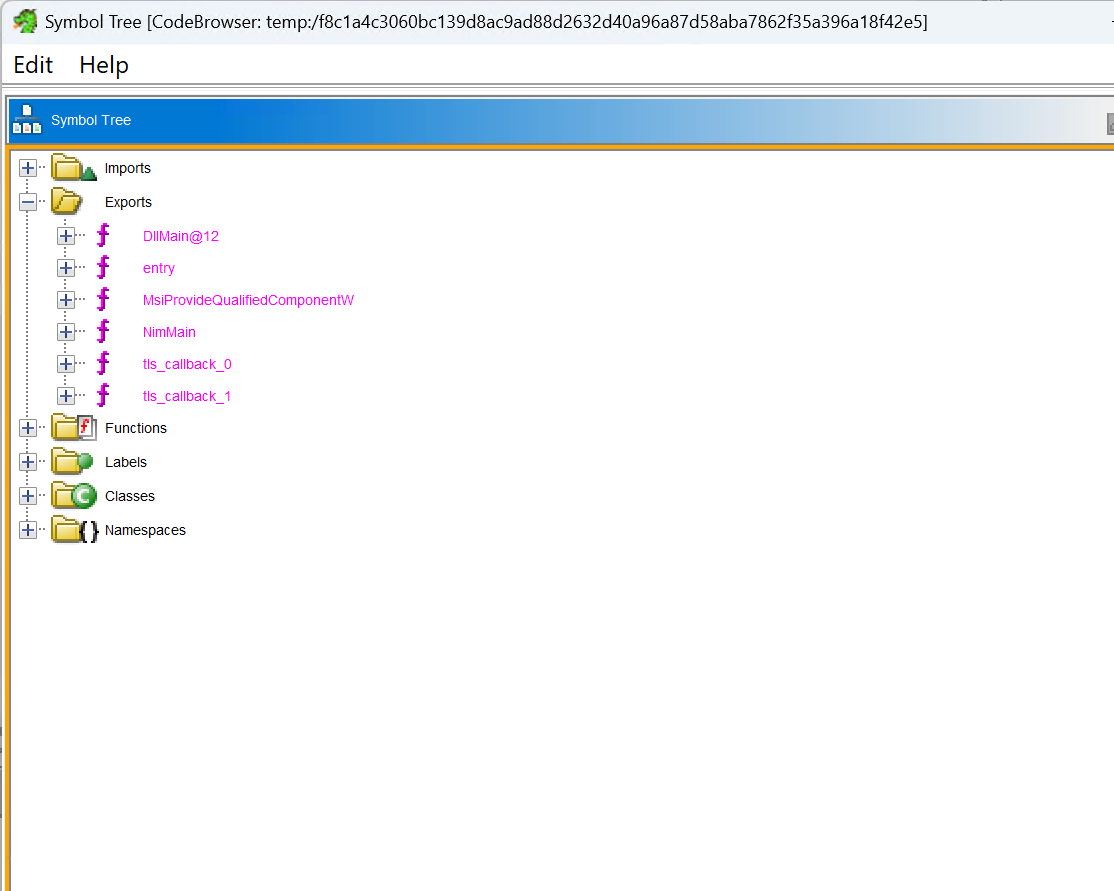
It exports only two interesting functions, NimMain and MSIProvideQualifiedComponentW, DllMain is essentially redirected to NimMain, so we can focus on NimMain for our analysis.
That's a start, now let's look at the imports.
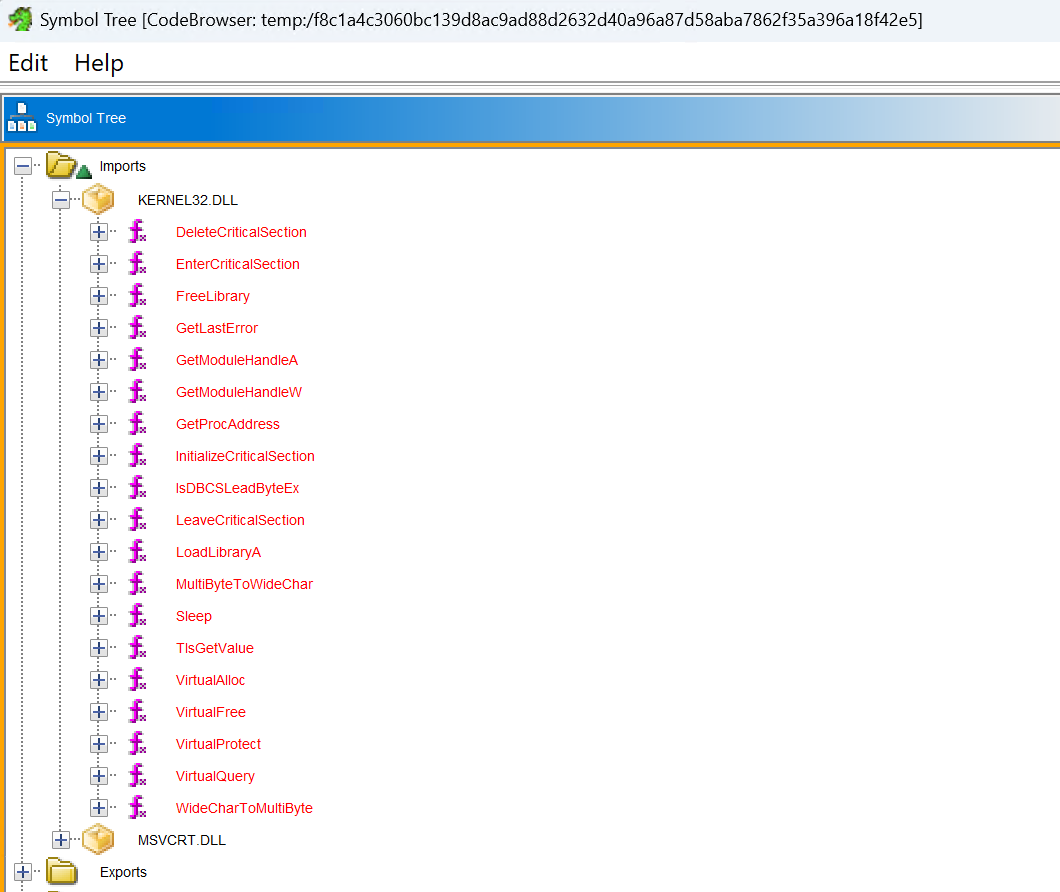
Unsurprisingly, the DLL itself imports only very few functions, mostly related to loading libraries and resolving function addresses. This is typical for a loader, as its main purpose is to load and execute other code.
But what functions is it trying to load and execute? Since this file is quite small, it's unlikely to be a full-fledged malware on its own, then where is it loading functions from?
After digging into the code, we can see that it uses LoadLibraryA and GetProcAddress to dynamically load functions from kernel32.dll.
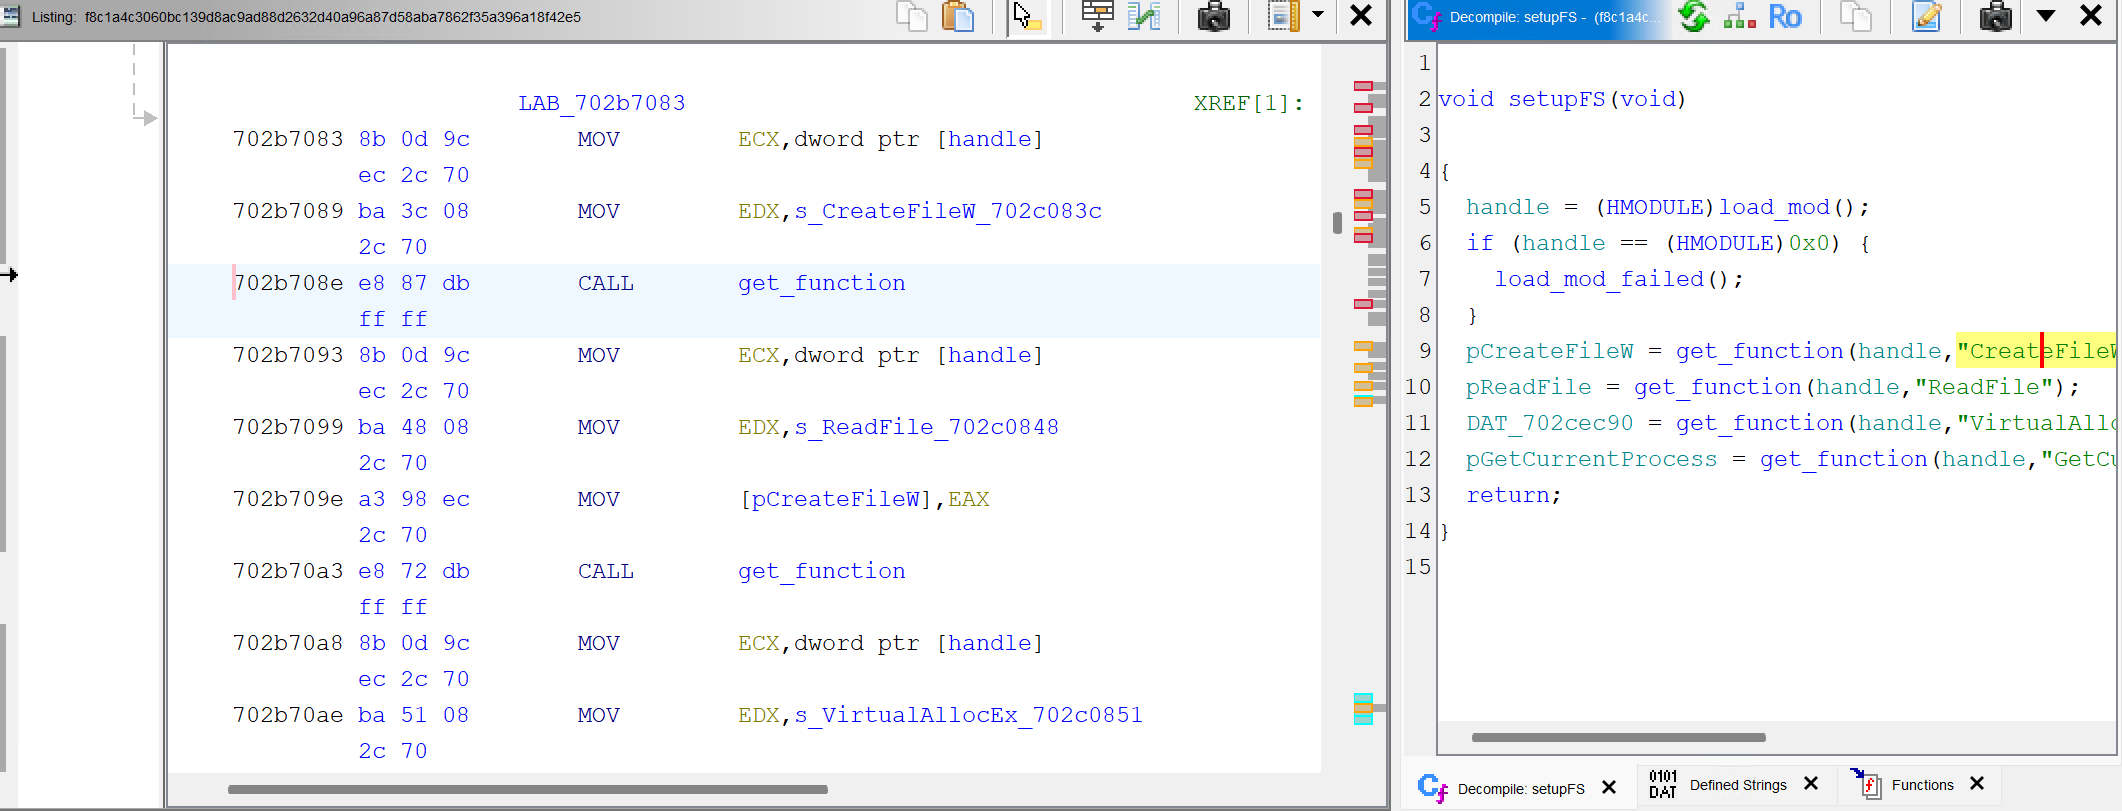
Well, it resolves a bunch of common functions in kernel32.dll, why? Why not just import them directly?
It might look confusing at first, but this is a common technique used by malware authors to evade static analysis. By dynamically resolving function addresses at runtime, the malware can make it harder for analysts to understand its behavior just by looking at the imports.
But where does it use the resolved functions? This is a million-dollar question.
You don't just import a bunch of functions for no reason, right?
The function we care about the most is CreateFileW, which is used to create or open files. If we can find where this function is called, we might be able to trace the file operations performed by the malware. In particular, this is where the loader might be loading its payload from.
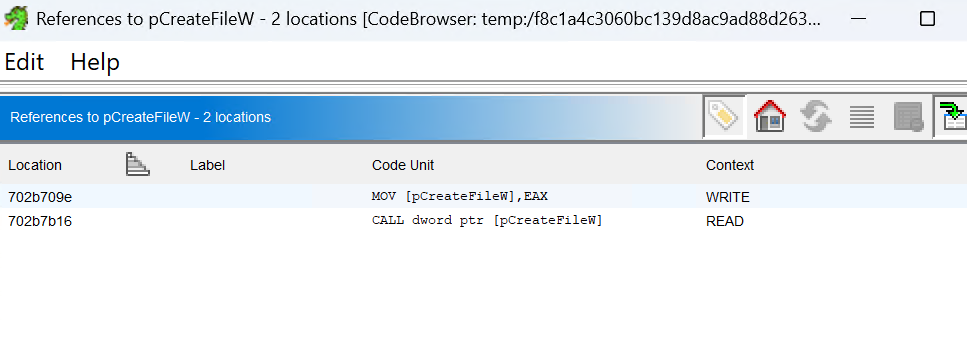
We use Ghidra's "References" feature to find all the places where CreateFileW is called. After examining the references, we can see that it's called in a functions that loads payload, we then move on to find out where it's being called from.
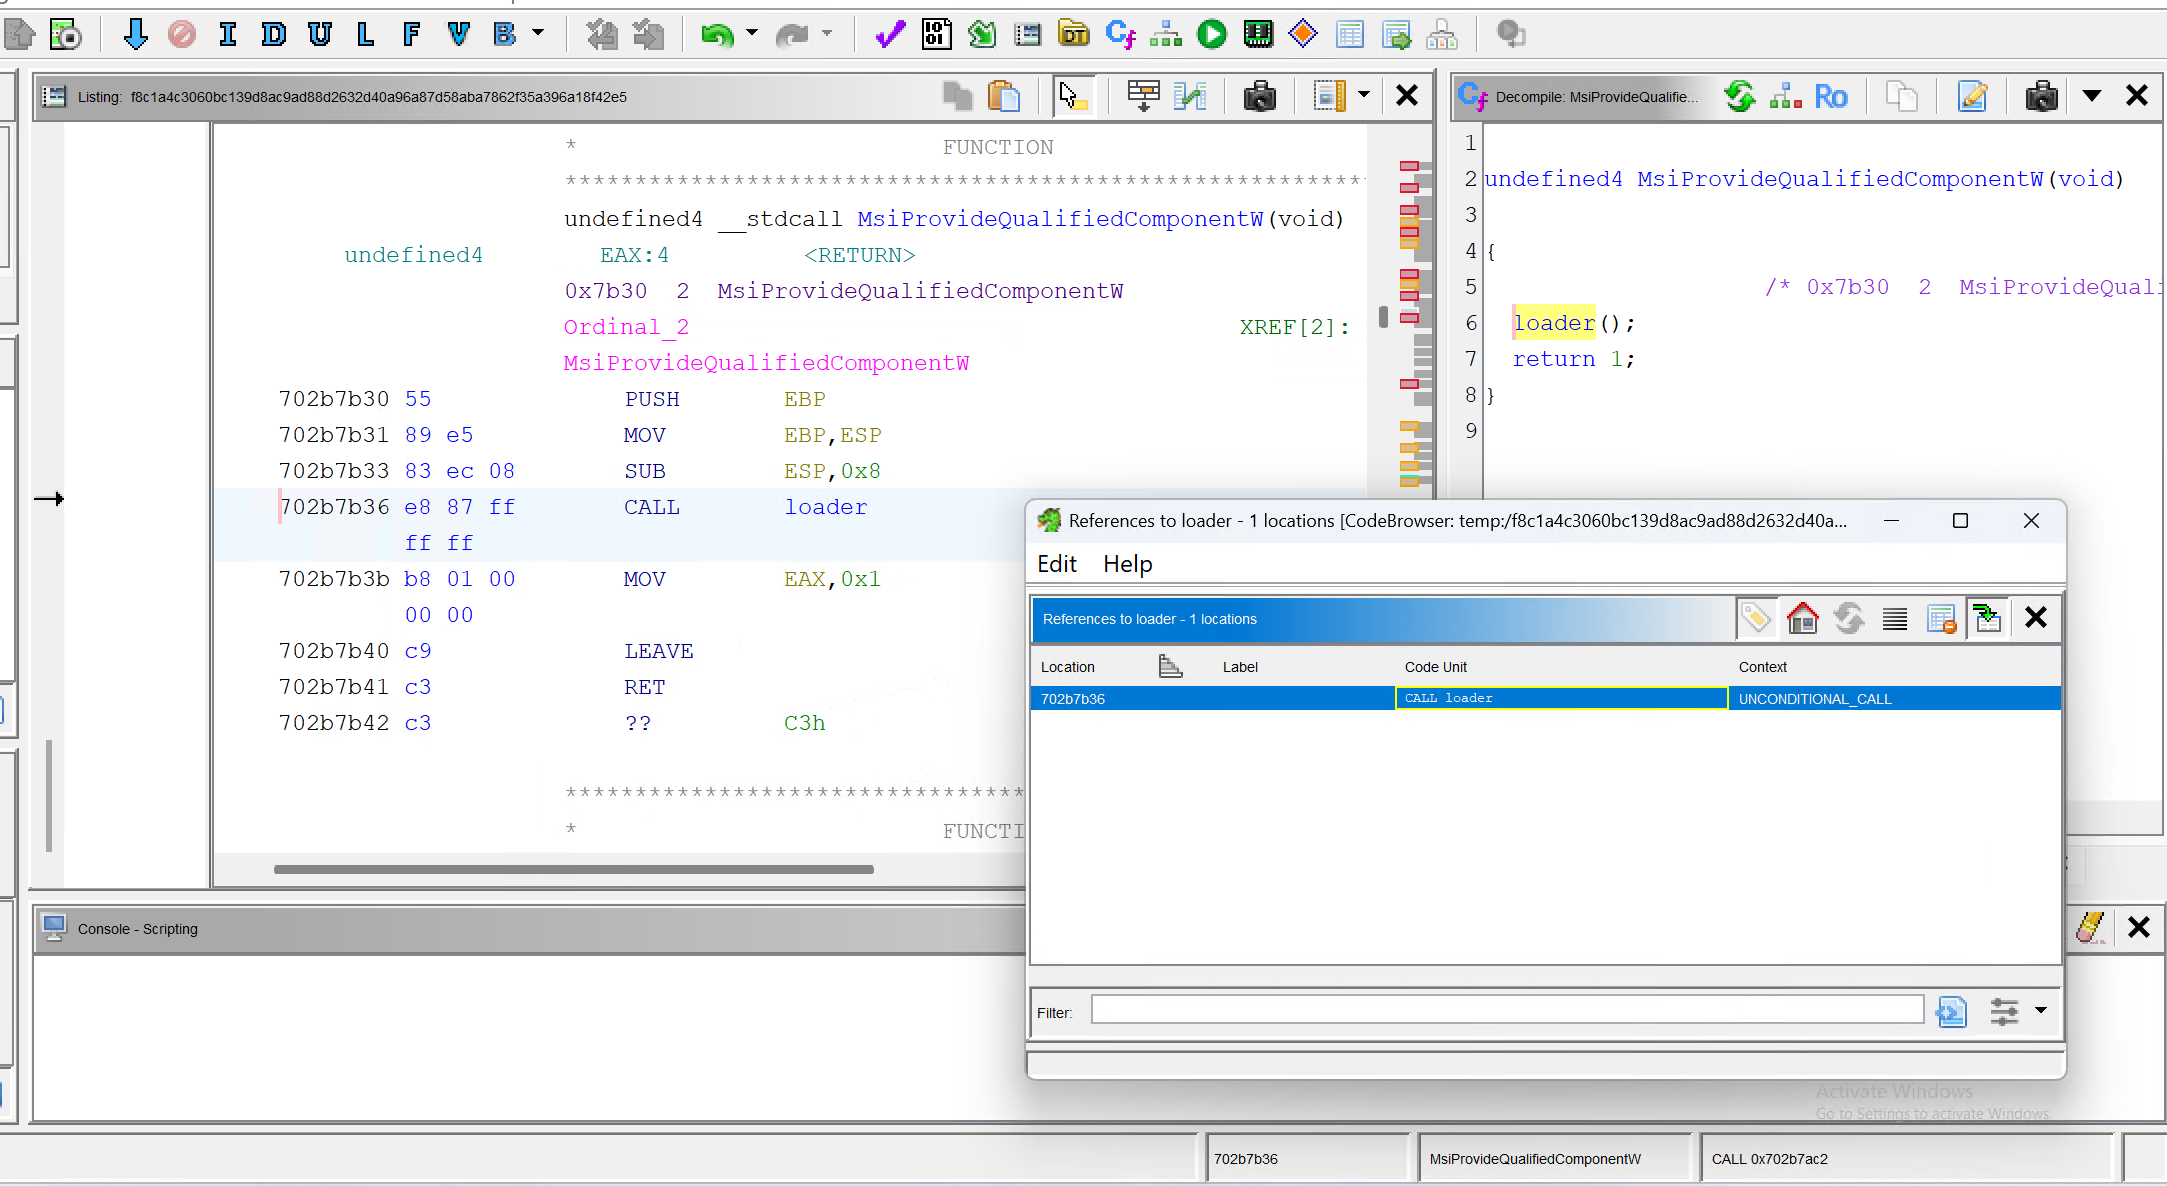
Surprise! It's MSIProvideQualifiedComponentW, one of the exported functions.
Now you know what's next.
Debug It for Runtime Data Extraction
Find Where to Set Breakpoints
Yes, to make our life easier, we can just debug the DLL with rundll32.exe invoking its MSIProvideQualifiedComponentW function, then we can set breakpoints on CreateFileW to see what file it's trying to open.
Hold on, how?
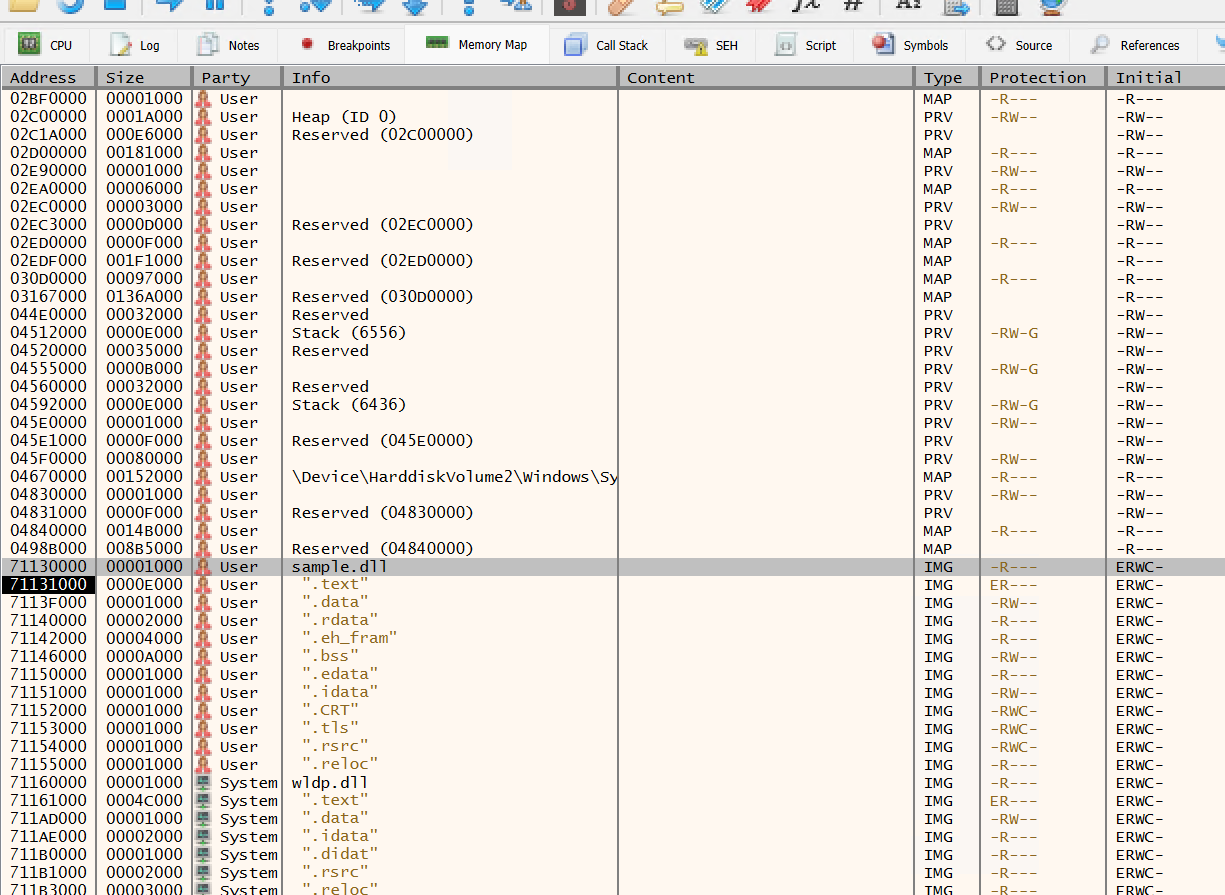
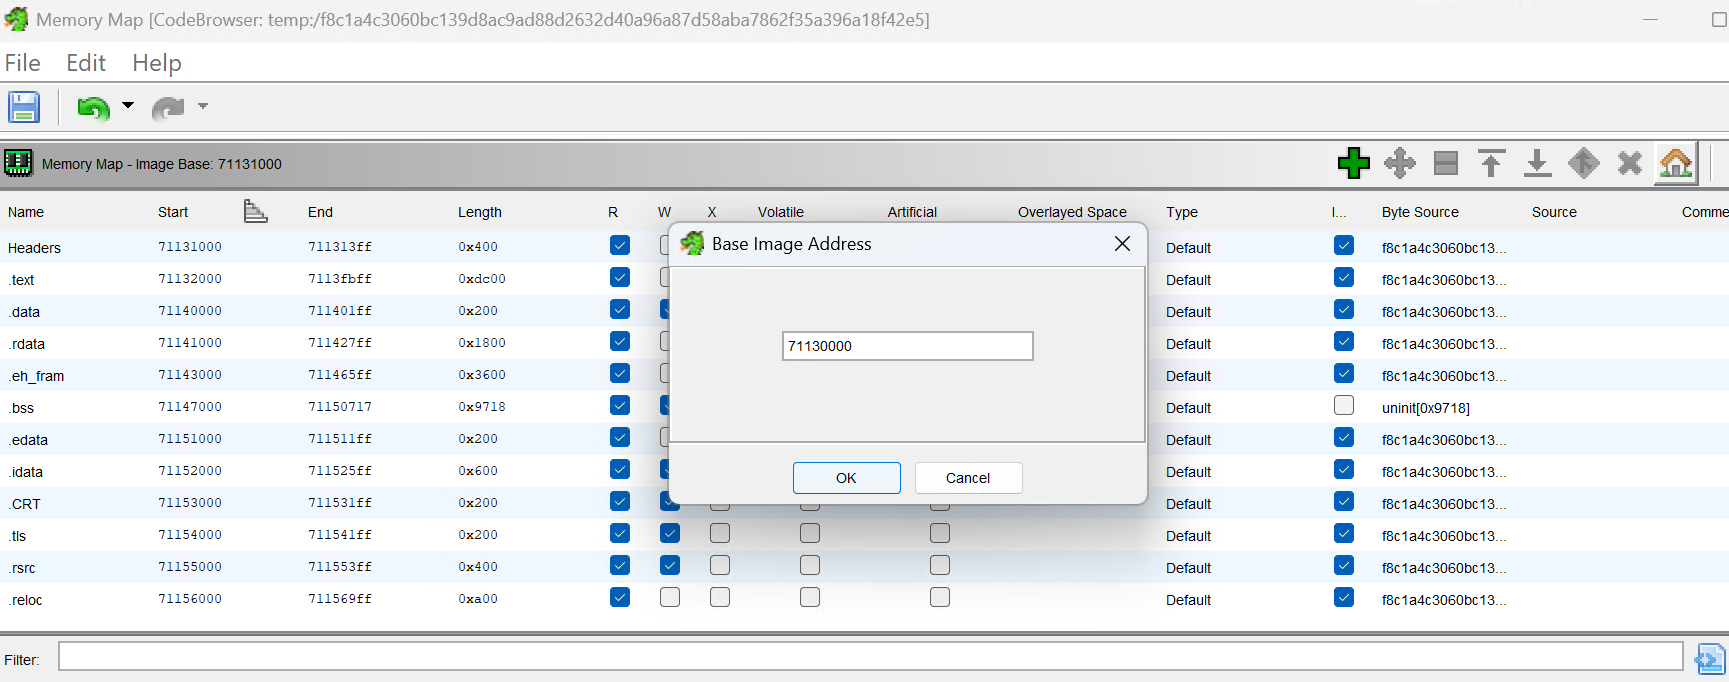
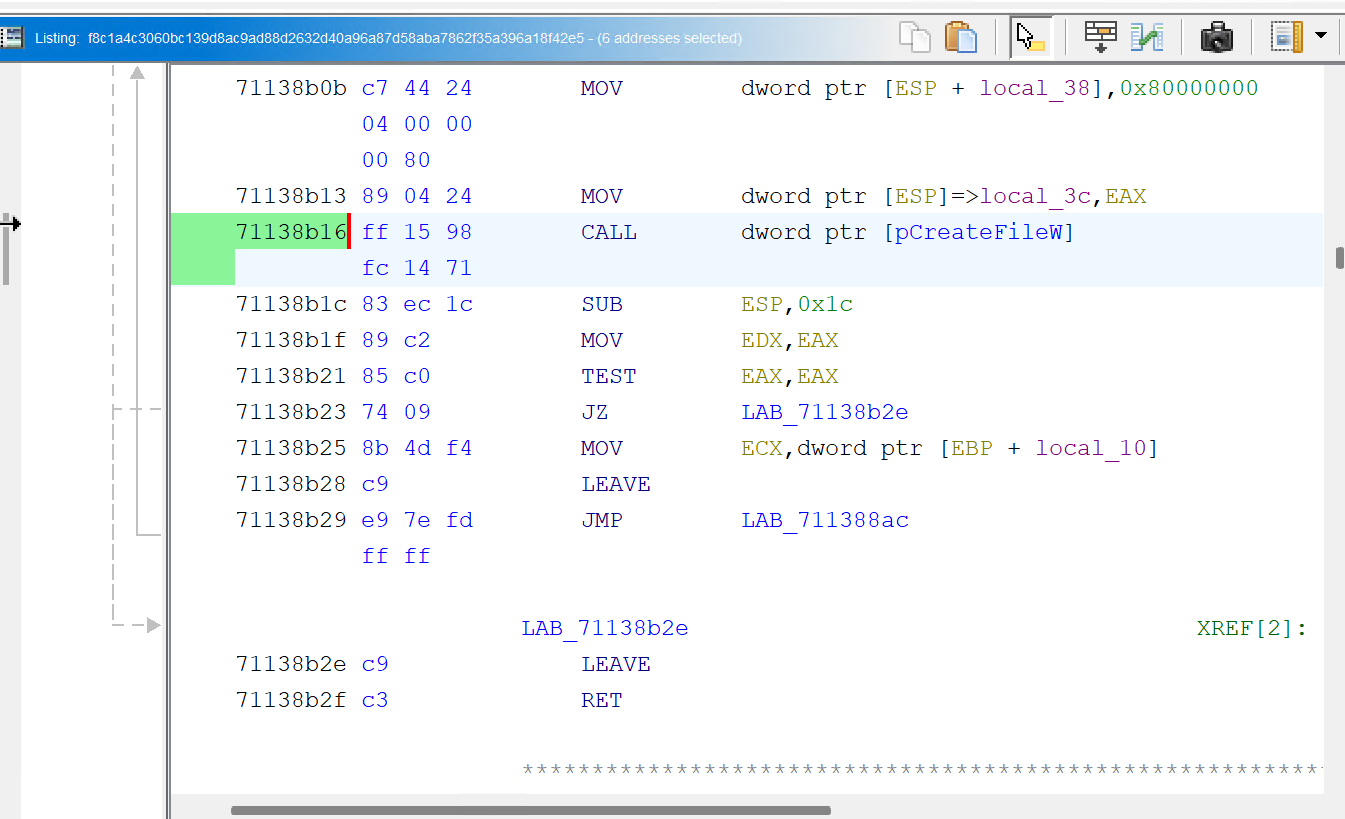
Assuming you understand the concept of ASLR and PIE binaries (randomised base memory address at runtime), well, this is one, you will have to rebase the binary in Ghidra using its runtime base address, so every address in Ghidra matches the actual address in memory.
And set base address in Ghidra accordingly.
Then we can set a breakpoint on CreateFileW at this address.
And don't forget to set a breakpoint on MSIProvideQualifiedComponentW as well, so we can step into it.
It Didn't Work, or Did It?
Even though we set the breakpoints correctly, it is still bypassed, thus no payload file is opened.
Looking closer, we can see that before calling CreateFileW, it calls some other functions for validation, which apparently fails and the payload opening is skipped.

Let's not care about how the validation works for now, we can just patch the instruction to bypass it.
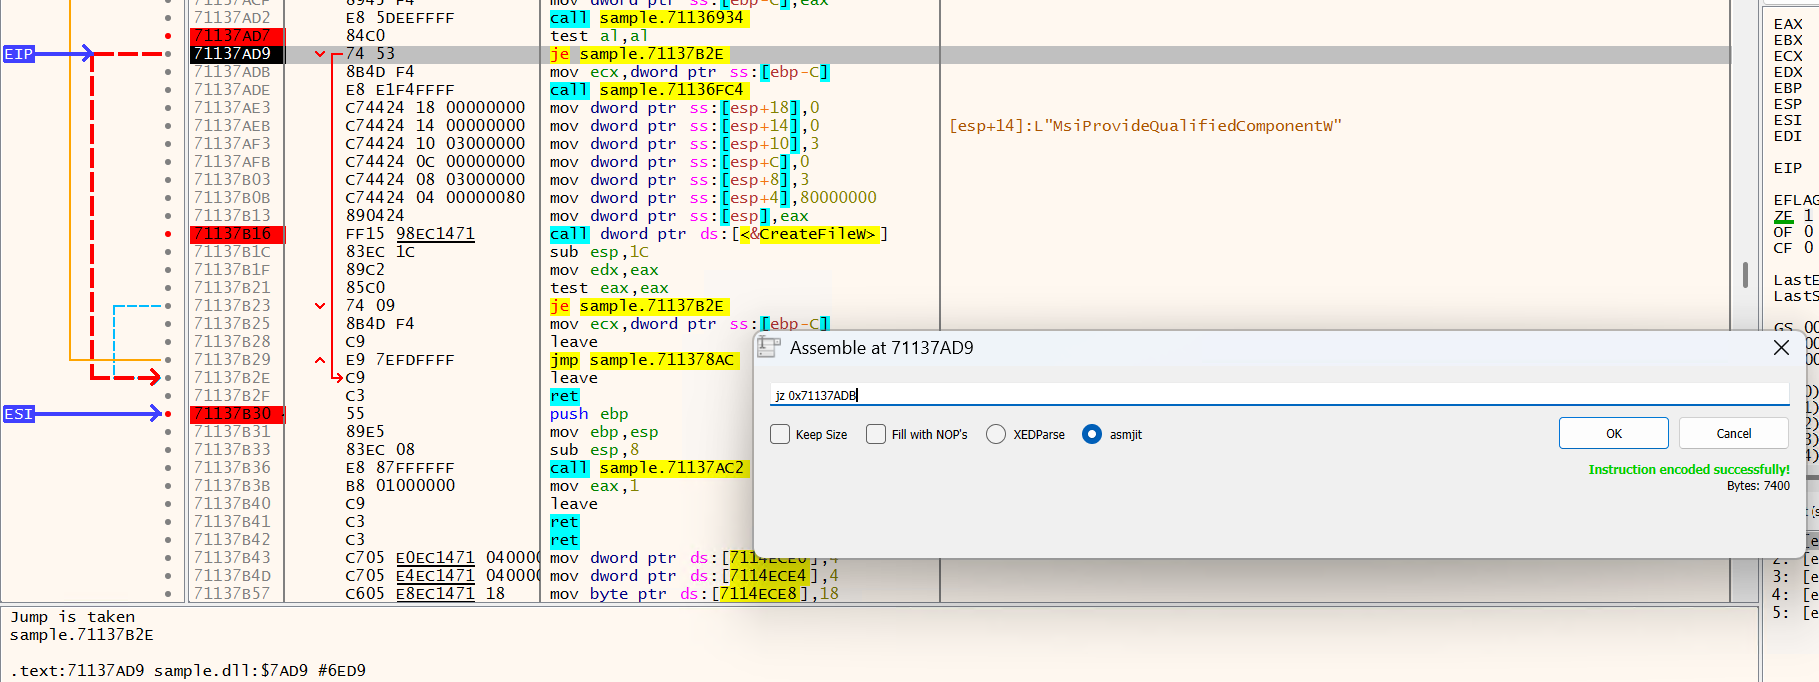
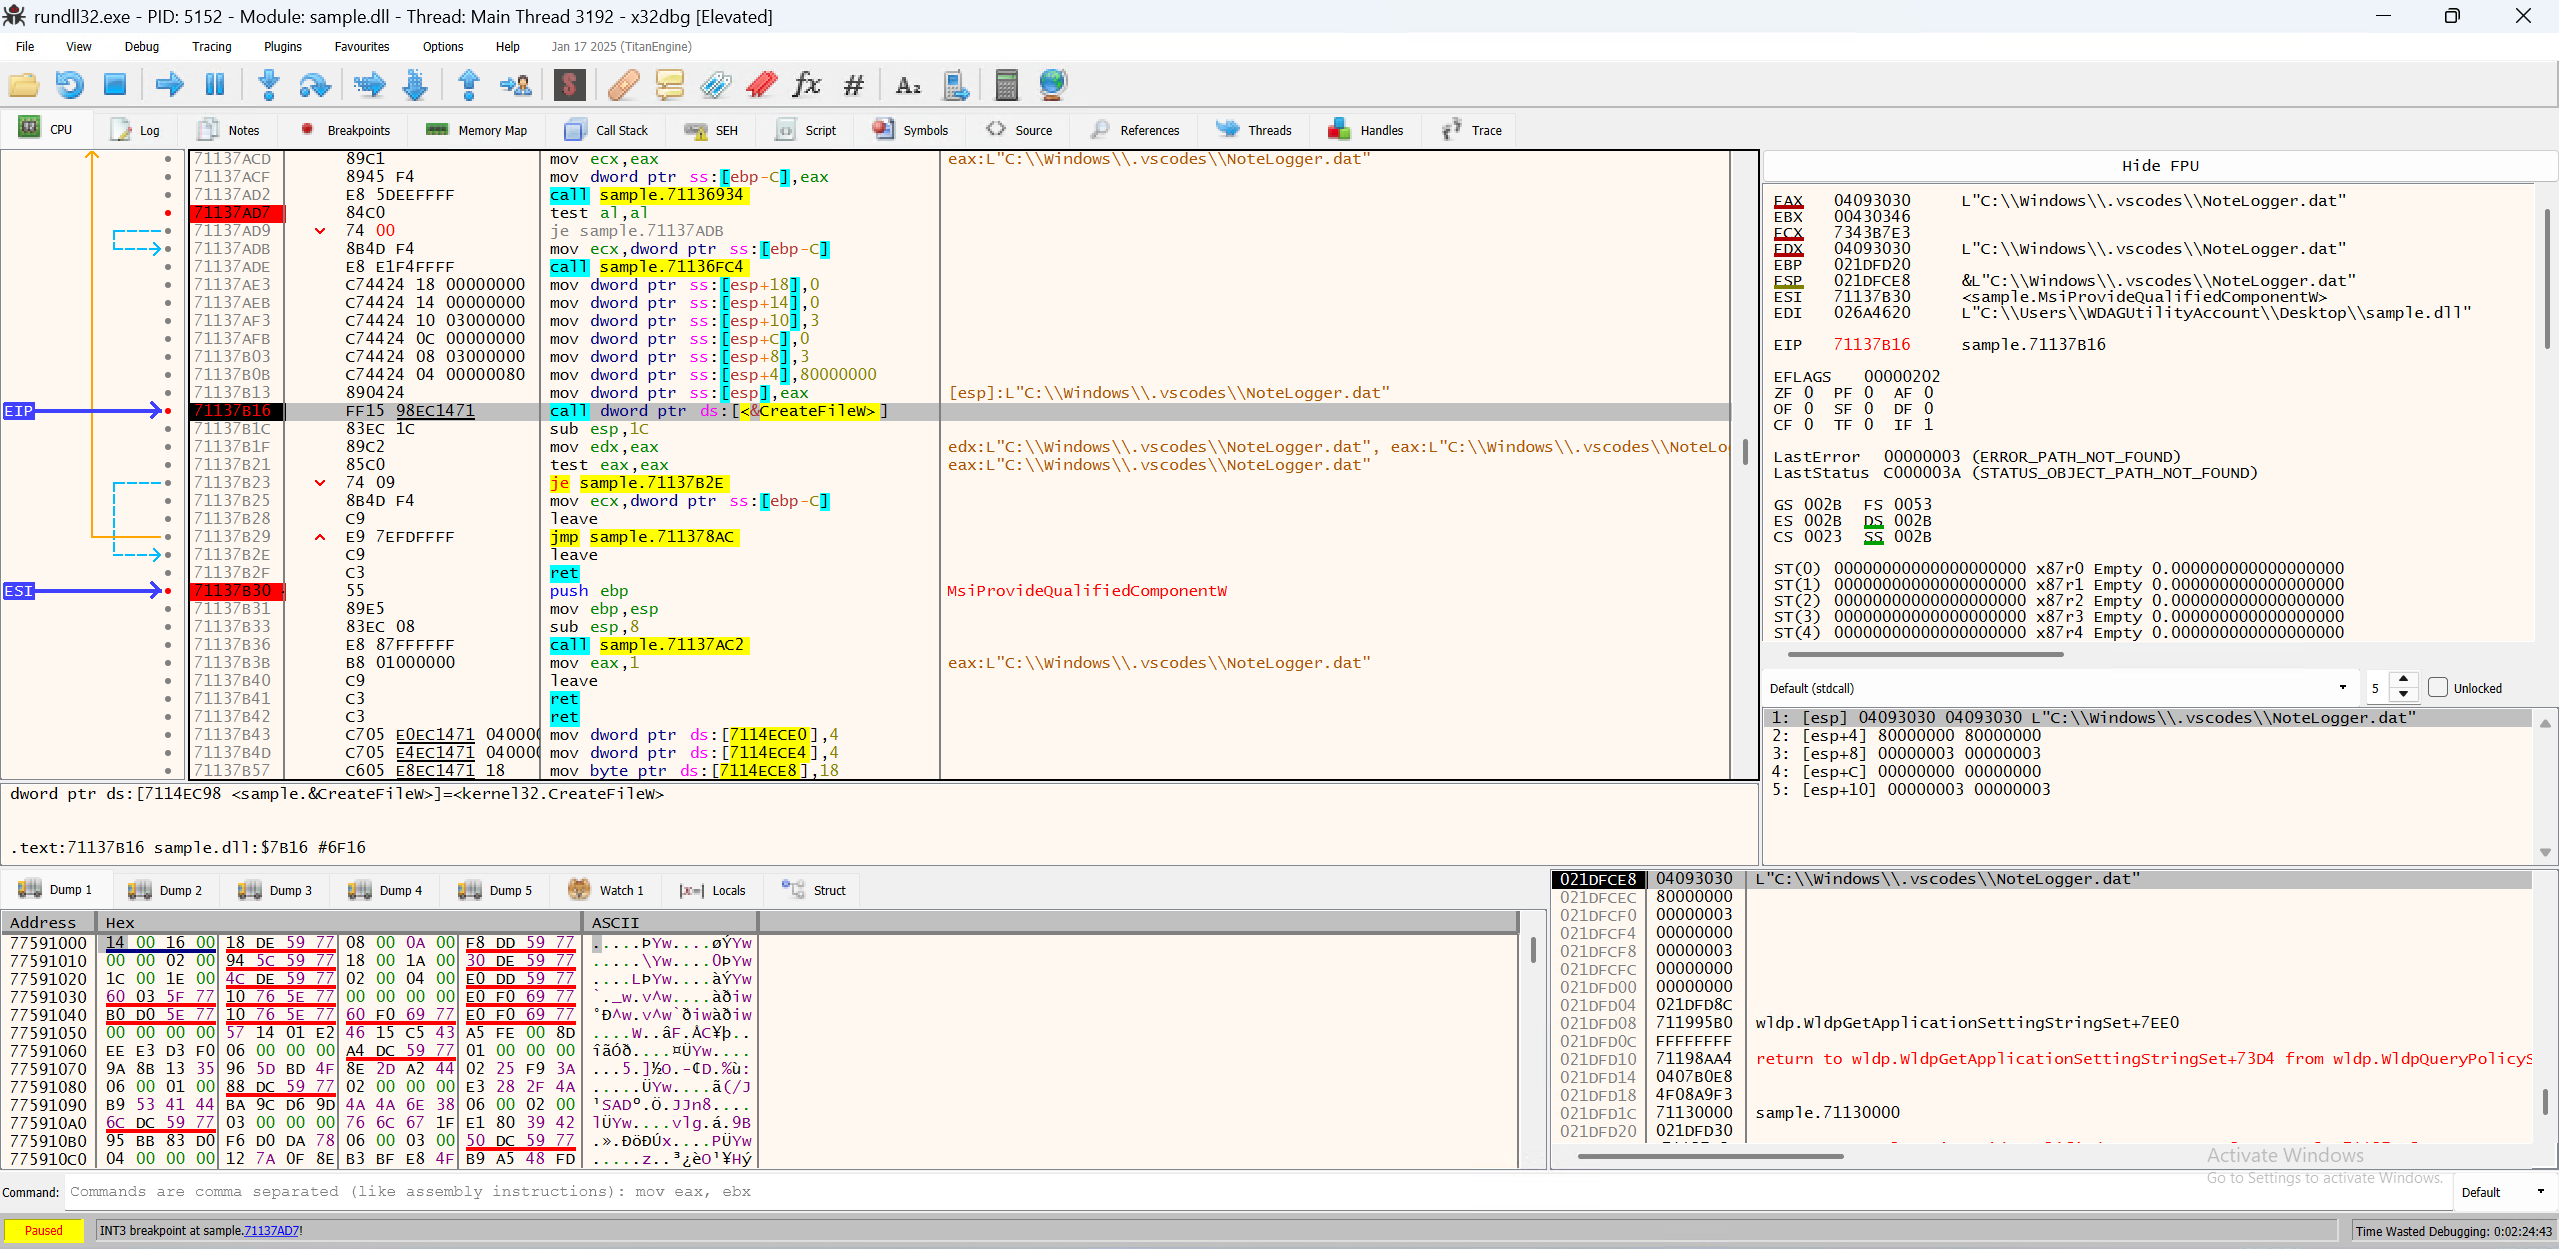
After patching the je instruction to continue execution, we can continue the debugger, and this time, we hit the CreateFileW breakpoint, and the filename finally pops up!
Conclusion
Reverse engineering is all about finding the right clues and following them to uncover the hidden functionality of a program. In this case, we successfully traced the loader's behavior to find out where it loads its payload from.
This is a rather small sample, but as you can see it has way more complexity than meets the eye. The techniques demonstrated here can be applied to more complex samples as well.
Because of its APT nature, this malware does everything it can to evade detection and analysis, but as long as you know where to look, you can tell their anti-debugging and obfuscation to fuck themselves, because we really don't care as long as we get what we want.
Comments
comments powered by Disqus